728x90
반응형
https://prometheus.io/download/
Download | Prometheus
An open-source monitoring system with a dimensional data model, flexible query language, efficient time series database and modern alerting approach.
prometheus.io
(설치방법 1) # AlertManager 설치 (바이너리 설치 권장)
# wget https://github.com/prometheus/alertmanager/releases/download/v0.27.0/alertmanager-0.27.0.linux-amd64.tar.gz

# tar xvzf alertmanager-0.27.0.linux-amd64.tar.gz

# mv alertmanager-0.27.0.linux-amd64 /etc/prometheus/alertmanager

# /etc/prometheus/alertmanager/./alertmanager &

  -- alertmanager를 백그라운드로 실행함
  -- alertmanager.service를 만들어서 systemctl start, restart, disable 로 관리해도 됨

# netstat -ntpa |grep LISTEN
tcp6       0      0 :::9093                 :::*                    LISTEN      6101/./alertmanager
tcp6       0      0 :::9094                 :::*                    LISTEN      6101/./alertmanager
# alertmanager를 systemctl {restart, start, disable, enable} 등으로 관리하려면 https://hwpform.tistory.com/134 참조
또는 (설치방법 2) # Docker AlertManager 설치
- docker 확인
# docker run --name alertmanager -d -p 9093:9093 quay.io/prometheus/alertmanager

# docker ps -a
CONTAINER ID   IMAGE                                           COMMAND                  CREATED         STATUS         PORTS                                       NAMES
77d5896ee529   quay.io/prometheus/alertmanager                 "/bin/alertmanager -…"   5 minutes ago   Up 5 minutes   0.0.0.0:9093->9093/tcp, :::9093->9093/tcp   alertmanager

# docmer images
REPOSITORY                                      TAG       IMAGE ID       CREATED        SIZE
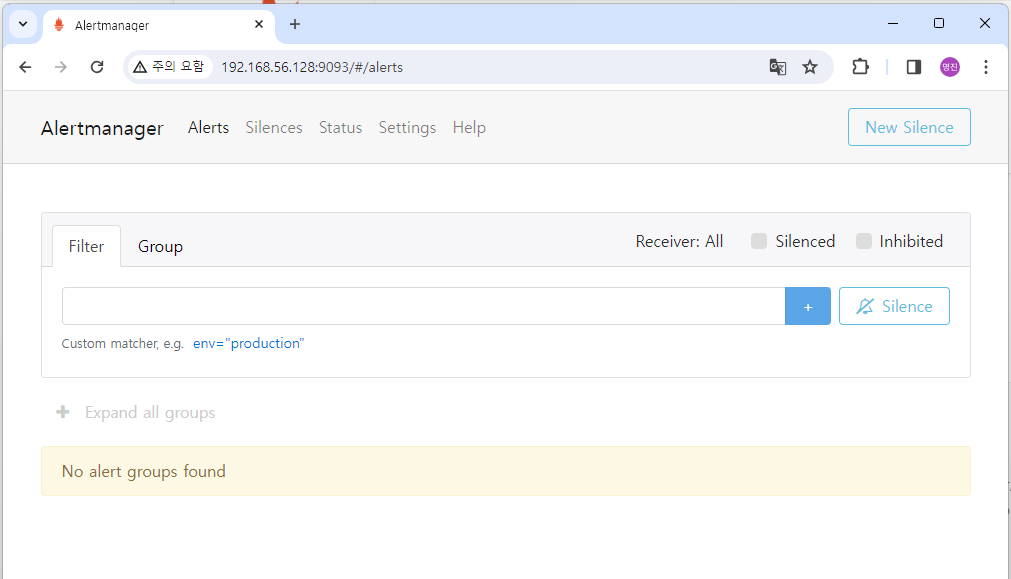
quay.io/prometheus/alertmanager latest 11f11916f8cd 2 days ago 70.3MB- web페이지 확인 http://192.168.56.128:9093

# prometheus 서버에 alertmanager 설정
# cat /etc/prometheus/prometheus.yml

# my global config
global:
  scrape_interval: 15s
  evaluation_interval: 15s

# Alertmanager configuration
alerting:
  alertmanagers:
    - static_configs:
        - targets:
          - 192.168.56.128:9093

# Load rules once and periodically evaluate them according to the global 'evaluation_interval'.
rule_files:
  - "/etc/prometheus/alertmanager/rules/test_rule.yml"
  - "/etc/prometheus/alertmanager/rules/alert_rules.yml"
- Alertmanager rules 설정
- 참고사이트 https://prometheus.io/docs/prometheus/latest/configuration/alerting_rules/
Alerting rules | Prometheus
An open-source monitoring system with a dimensional data model, flexible query language, efficient time series database and modern alerting approach.
prometheus.io
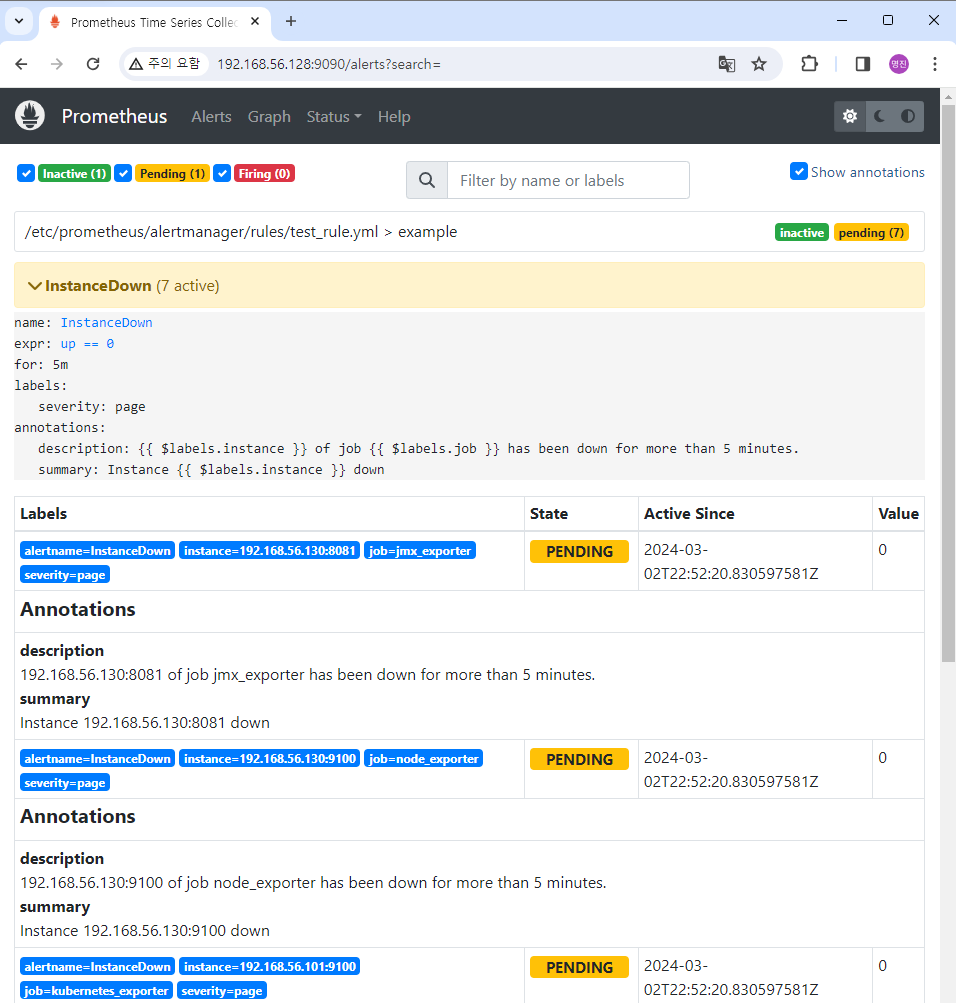
# cat /etc/prometheus/alertmanager/rules/test_rule.yml

groups:
- name: example
  rules:

  # Alert for any instance that is unreachable for >5 minutes.
  - alert: InstanceDown
    expr: up == 0
    for: 5m
    labels:
      severity: page
    annotations:
      summary: "Instance {{ $labels.instance }} down"
      description: "{{ $labels.instance }} of job {{ $labels.job }} has been down for more than 5 minutes."

  # Alert for any instance that has a median request latency >1s.
  - alert: APIHighRequestLatency
    expr: api_http_request_latencies_second{quantile="0.5"} > 1
    for: 10m
    annotations:
      summary: "High request latency on {{ $labels.instance }}"
      description: "{{ $labels.instance }} has a median request latency above 1s (current value: {{ $value }}s)"
# cat alert_rules.yml
groups:
- name: alert.rules
rules:
- alert: InstanceDown
expr: up == 0
for: 1m
labels:
severity: "critical"
annotations:
summary: "Endpoint {{ $labels.instance }} down"
description: "{{ $labels.instance }} of job {{ $labels.job }} has been down for more than 1 minutes."
- alert: HostOutOfMemory
expr: node_memory_MemAvailable_bytes / node_memory_MemTotal_bytes * 100 < 10
for: 2m
labels:
severity: warning
annotations:
summary: "Host out of memory (instance {{ $labels.instance }})"
description: "Node memory is filling up (< 10% left)\n VALUE = {{ $value }}\n LABELS: {{ $labels }}"
- alert: HostMemoryUnderMemoryPressure
expr: rate(node_vmstat_pgmajfault[1m]) > 1000
for: 2m
labels:
severity: warning
annotations:
summary: "Host memory under memory pressure (instance {{ $labels.instance }})"
description: "The node is under heavy memory pressure. High rate of major page faults\n VALUE = {{ $value }}\n LABELS: {{ $labels }}"
# Please add ignored mountpoints in node_exporter parameters like
# "--collector.filesystem.ignored-mount-points=^/(sys|proc|dev|run)($|/)".
# Same rule using "node_filesystem_free_bytes" will fire when disk fills for non-root users.
- alert: HostOutOfDiskSpace
expr: (node_filesystem_avail_bytes * 100) / node_filesystem_size_bytes < 10 and ON (instance, device, mountpoint) node_filesystem_readonly == 0
for: 2m
labels:
severity: warning
annotations:
summary: "Host out of disk space (instance {{ $labels.instance }})"
description: "Disk is almost full (< 10% left)\n VALUE = {{ $value }}\n LABELS: {{ $labels }}"
- alert: HostHighCpuLoad
expr: 100 - (avg by(instance) (rate(node_cpu_seconds_total{mode="idle"}[2m])) * 100) > 80
for: 0m
labels:
severity: warning
annotations:
summary: "Host high CPU load (instance {{ $labels.instance }})"
description: "CPU load is > 80%\n VALUE = {{ $value }}\n LABELS: {{ $labels }}"
- prometheus 서버 재기동
# systemctl restart prometheus
Prometheus 및 Alertmanager 동작확인
- 설치기본 정보 확인
# netstat -ntpa |grep LISTEN
tcp6       0      0 :::9090                 :::*                    LISTEN      8085/prometheus
tcp6       0      0 :::9093                 :::*                    LISTEN      6101/./alertmanager
tcp6 0 0 :::9094 :::* LISTEN 6101/./alertmanager| 포트 | 프로세서 명 | 설치위치 및 파일 | web 접속 |
| 9090 | prometheus | /etc/prometheus/prometheus.yml | http://192.168.56.128:9090 |
| 9093 9094 |
alertmanager | /etc/prometheus/alertmanager/alertmanager /etc/prometheus/alertmanager/alertmanager/rules |
http://192.168.56.128:9093 |
- prometheus 동작 확인 http://192.168.56.128:9090


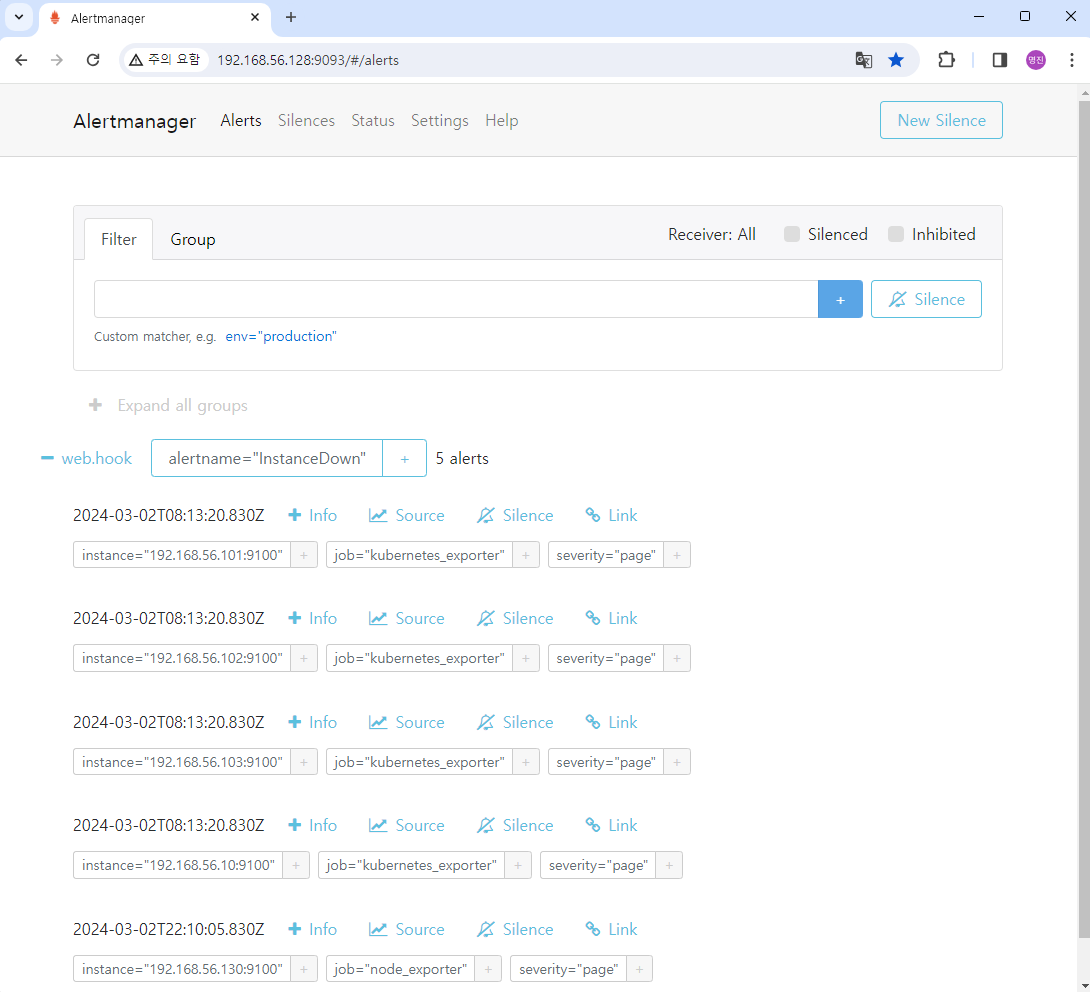
- AlertManager 동작확인

728x90
반응형
LIST
'Manage OpenSource > Prometheus - Grafana' 카테고리의 다른 글
| Prometheus Third-party exporters Nvidia-docker 설치 (0) | 2024.03.09 |
|---|---|
| Prometheus Pushgateway 설치 (1) | 2024.03.09 |
| Prometheus Client pip3 python3 설치 (0) | 2024.03.09 |
| Prometheus Alertmanager 설치 -2 (slack연결) (0) | 2024.03.03 |
| Prometheus - Grafana 설치 (1) (0) | 2024.03.01 |